Add logging for a data point
When logging is enabled, the gateway collects values from the data point according to the selected type and interval.
Written By Evolo Support
Last updated About 2 months ago
Here's how to do it
Go to Configuration and select Logging.
Click Add Logging.
Select the data point to log.
Select the logging type.
Select the interval.
Save.
Select the interval
Select how often the top-level system should retrieve data.
1 min and 5 min cause the host system to send a request to the building for data at the selected interval.
If changes occur, data is logged as soon as updates are available. This should only be used for event-based protocols, such as KNX and BACnet.
Select type
Standard displays logged data as a line chart.
Cumulative displays data as a bar chart and is suitable, for example, for energy meters.
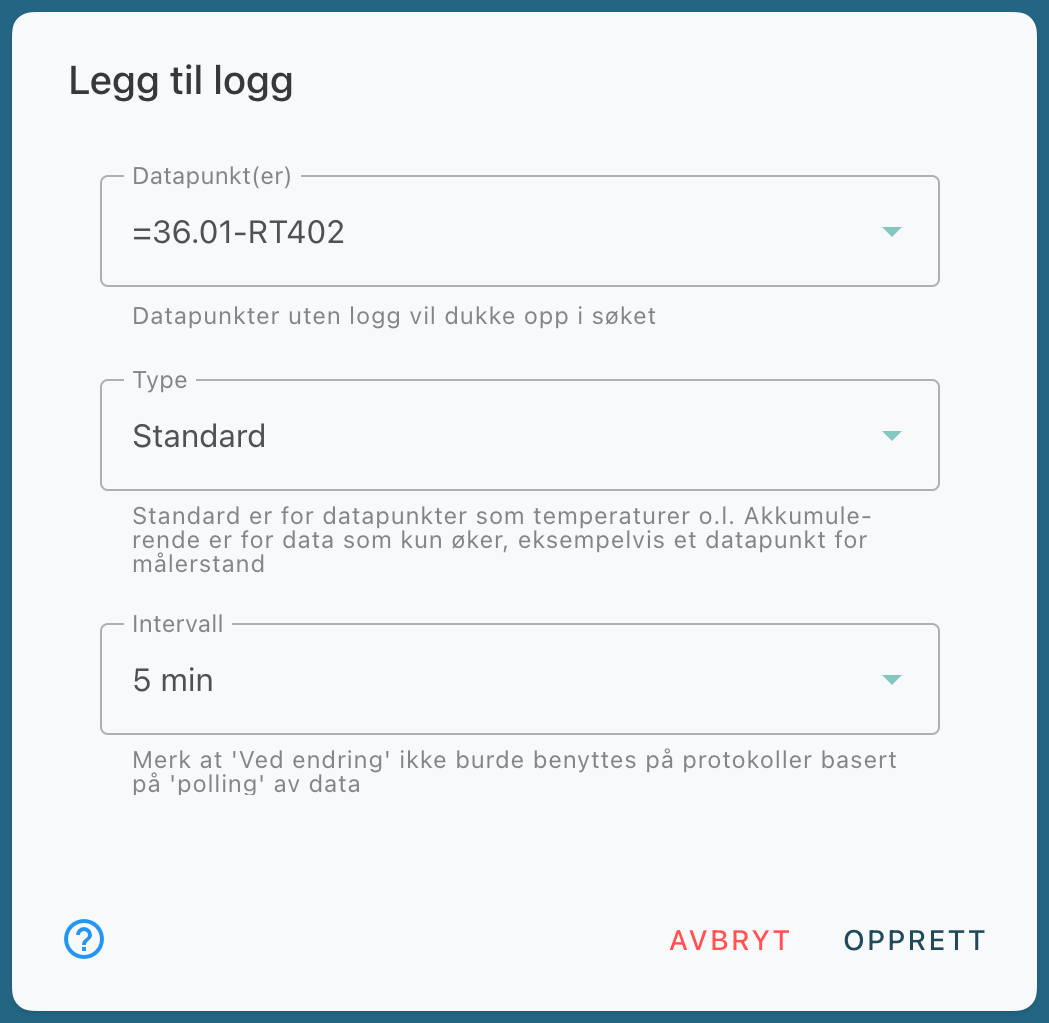
Once logging has been added, you can proceed to views, alarms, and calendar.
Color and Y-Axis in Charts
Once the log has been created, you can reopen the log entry to control how the data point is displayed in graphs.
Color
Select a fixed color if you want the data point to always appear in the same color in graphs.
Y-Axis
Select which Y-axis the data point should use in graphs:
Left
Right
If the field is left blank, Evolo automatically selects the y-axis based on the data points and units displayed in the graph.
Update multiple log points
You can also select multiple log points and update their color or y-axis simultaneously.
When performing a bulk update, a blank value means that the existing setting remains unchanged.
Troubleshooting
Logging Stops
Probable cause:
The gateway has incorrect time settings.
Solution:
Verify that the gateway has the correct time. You can use NTP to keep the clock synchronized.
Still need help? Ask the team