Dashboard with Your Projects
Get a comprehensive overview of your buildings, technical systems, alarms, and indoor climate all in one view.
Written By Evolo Support
Last updated 2 months ago
Here you can choose which widgets to display and get quick access to information about system operation, alarms, and indoor climate.
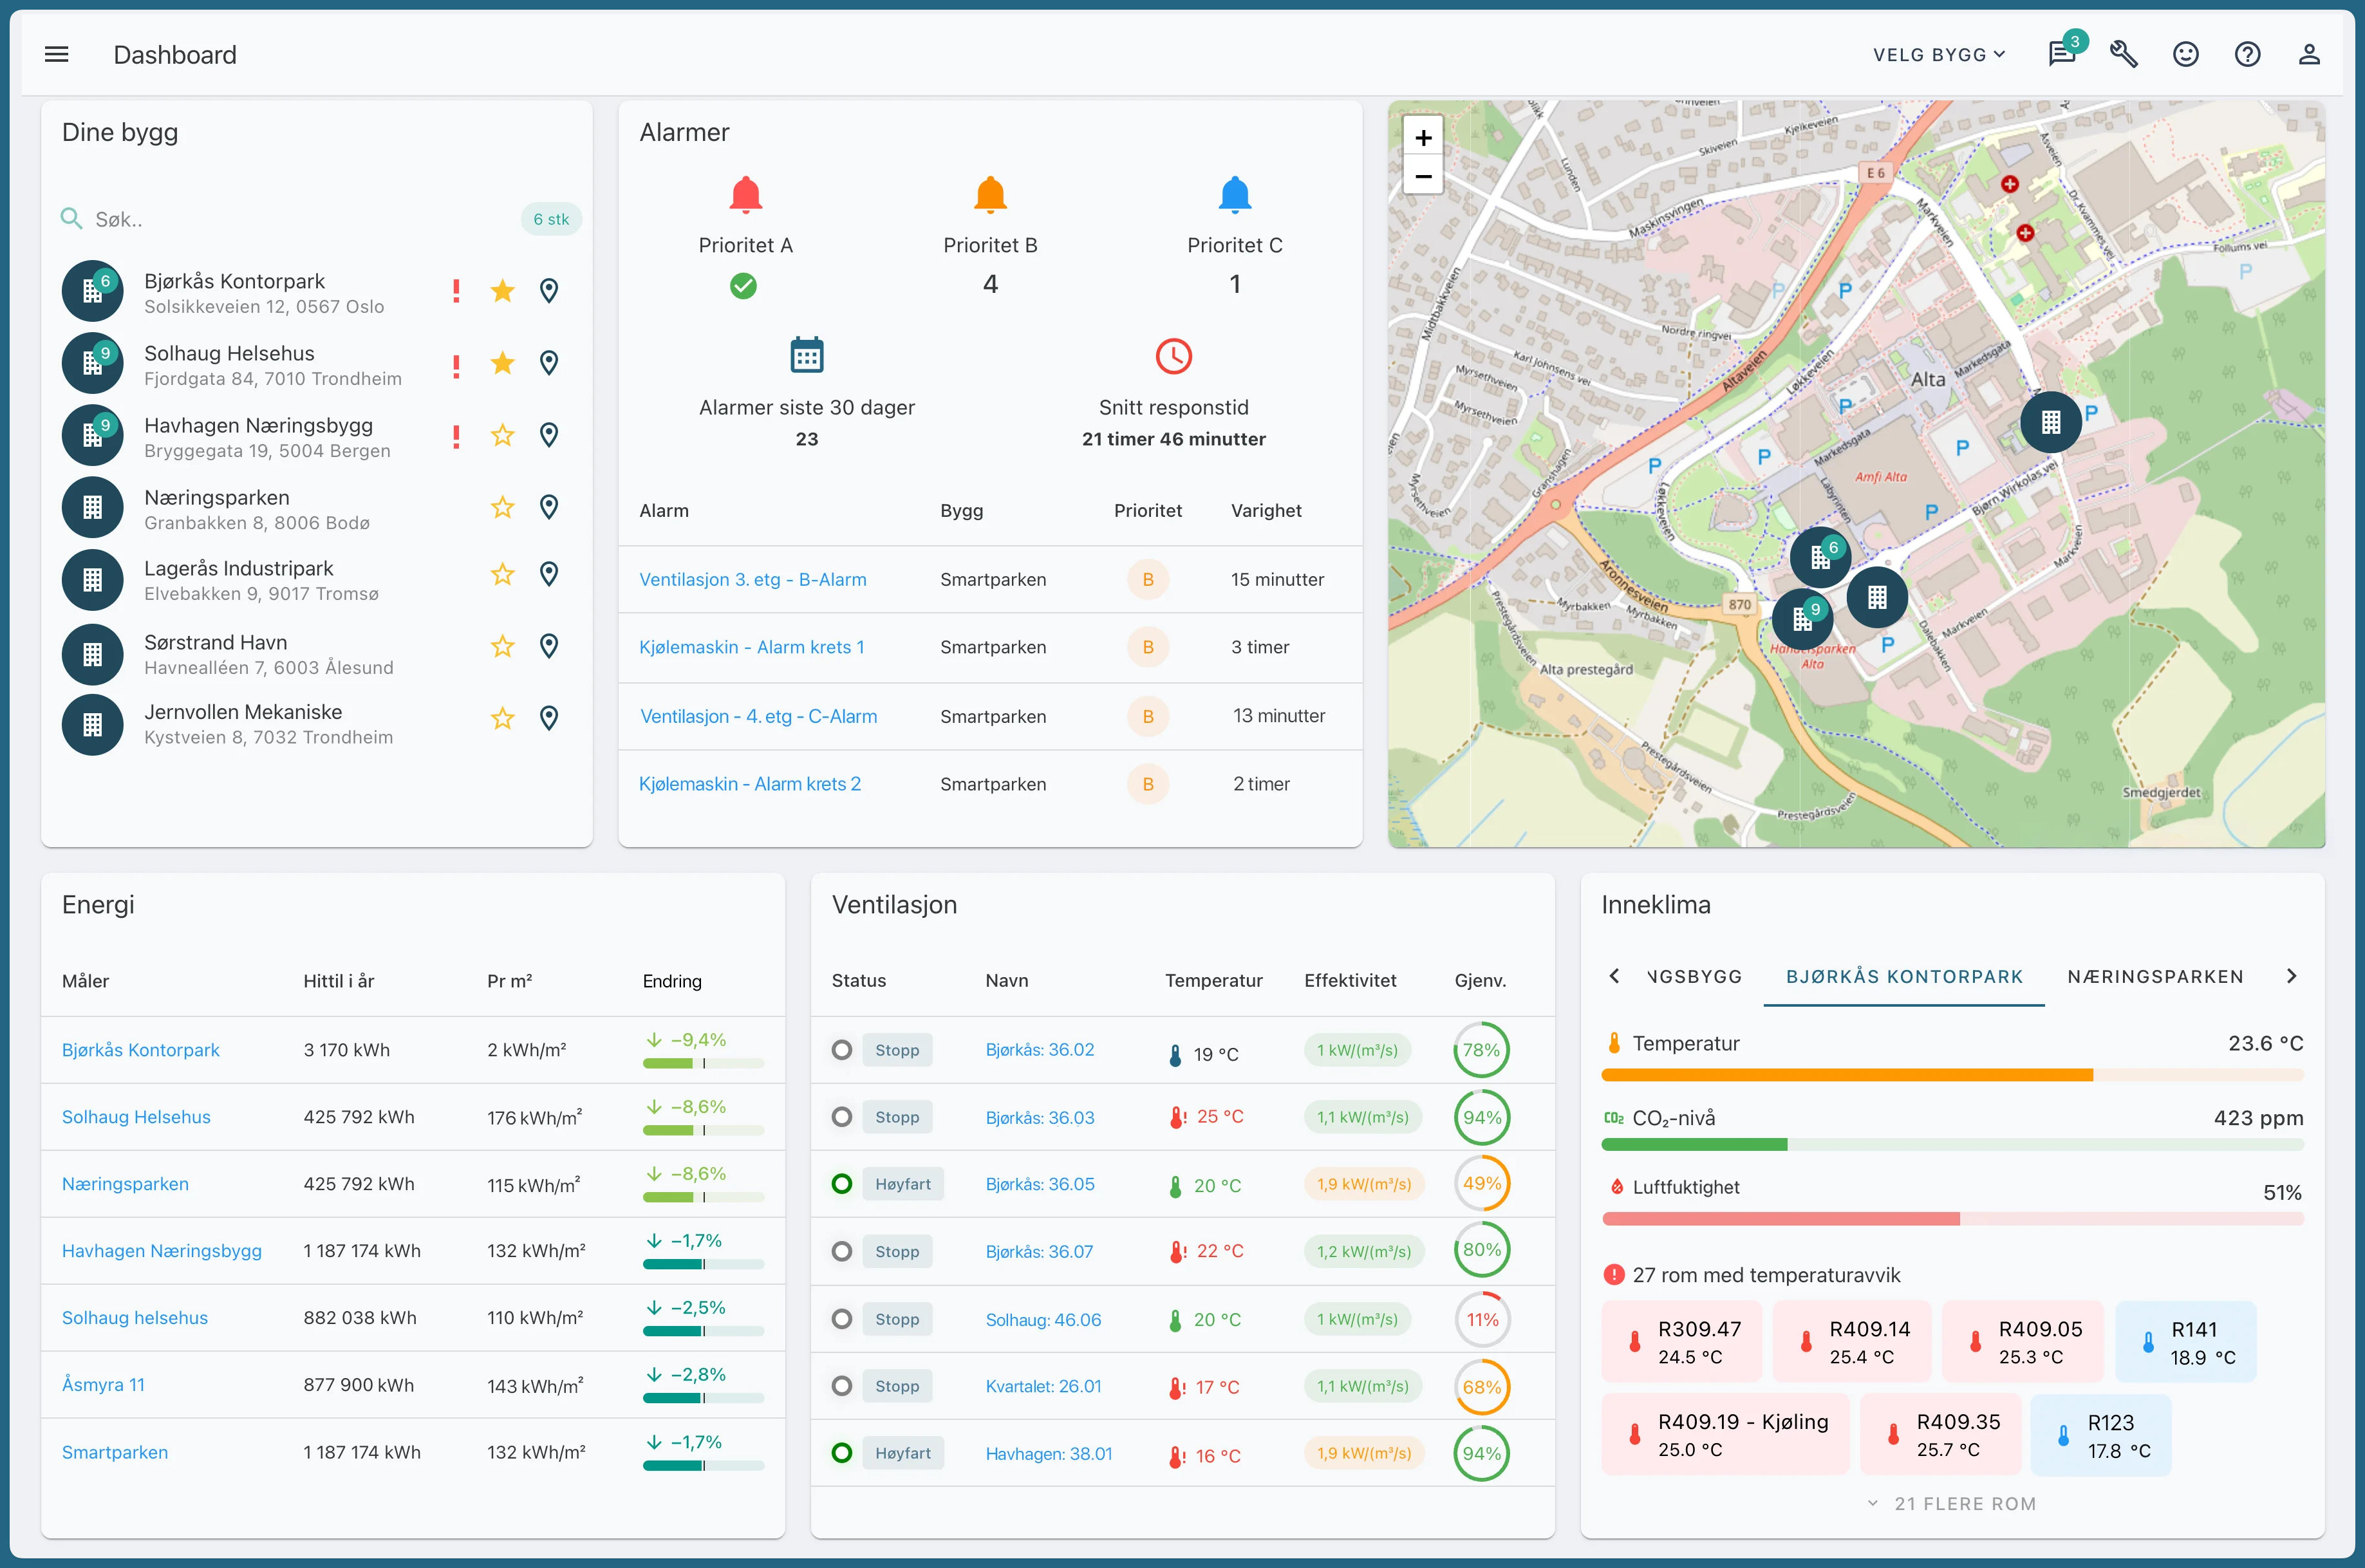
Widgets
The dashboard can be customized with widgets. Click the widget icon in the upper-right corner to add the widgets you want to display.
Your Buildings
Displays a searchable list of buildings in the organization.
Each building can be marked as a favorite for quicker access.
Builds with active alerts are displayed with an alert icon.
Map
Displays a map of all buildings and their locations.
Buildings are marked with icons.
You can zoom in on the map and click on a building for more information.
Ventilation
Displays the status and key metrics for ventilation systems.
Mode, such as stop, normal, or high speed
System name
Temperature relative to setpoint
Efficiency (SFP) – specific fan power
Recovery rate
Alarms
Provides an overview of the alarm status in your buildings.
Number of active alarms broken down by Priority A, B, and C
Total number of alarms in the last 30 days
Average response time before alarms are acknowledged
A table showing the most recent alarms, including building name, priority, and duration
Indoor Climate
Displays key indicators for indoor climate in the buildings.
Average temperature
CO₂ level (air quality)
Number of rooms with motion detected (active rooms)
Number of rooms with temperature deviations from the setpoint
The widget also shows which rooms have deviations.
Calendar
Provides a comprehensive overview of operating times for calendar items in your buildings.
Status for each object: currently in operation, scheduled for later, or inactive
Timeline showing today’s operating window
Building names are displayed when items belong to multiple buildings
The actual control (start or extend operation) is performed on the building’s own dashboard
Setup of components for the Dashboard
The Information dialog in the view builder displays all data points that are in use.
In the Components tab, you can link components in the view to widgets on the dashboard.
Here’s how to do it
Click the Components tab in the view builder; you must have the Installer role
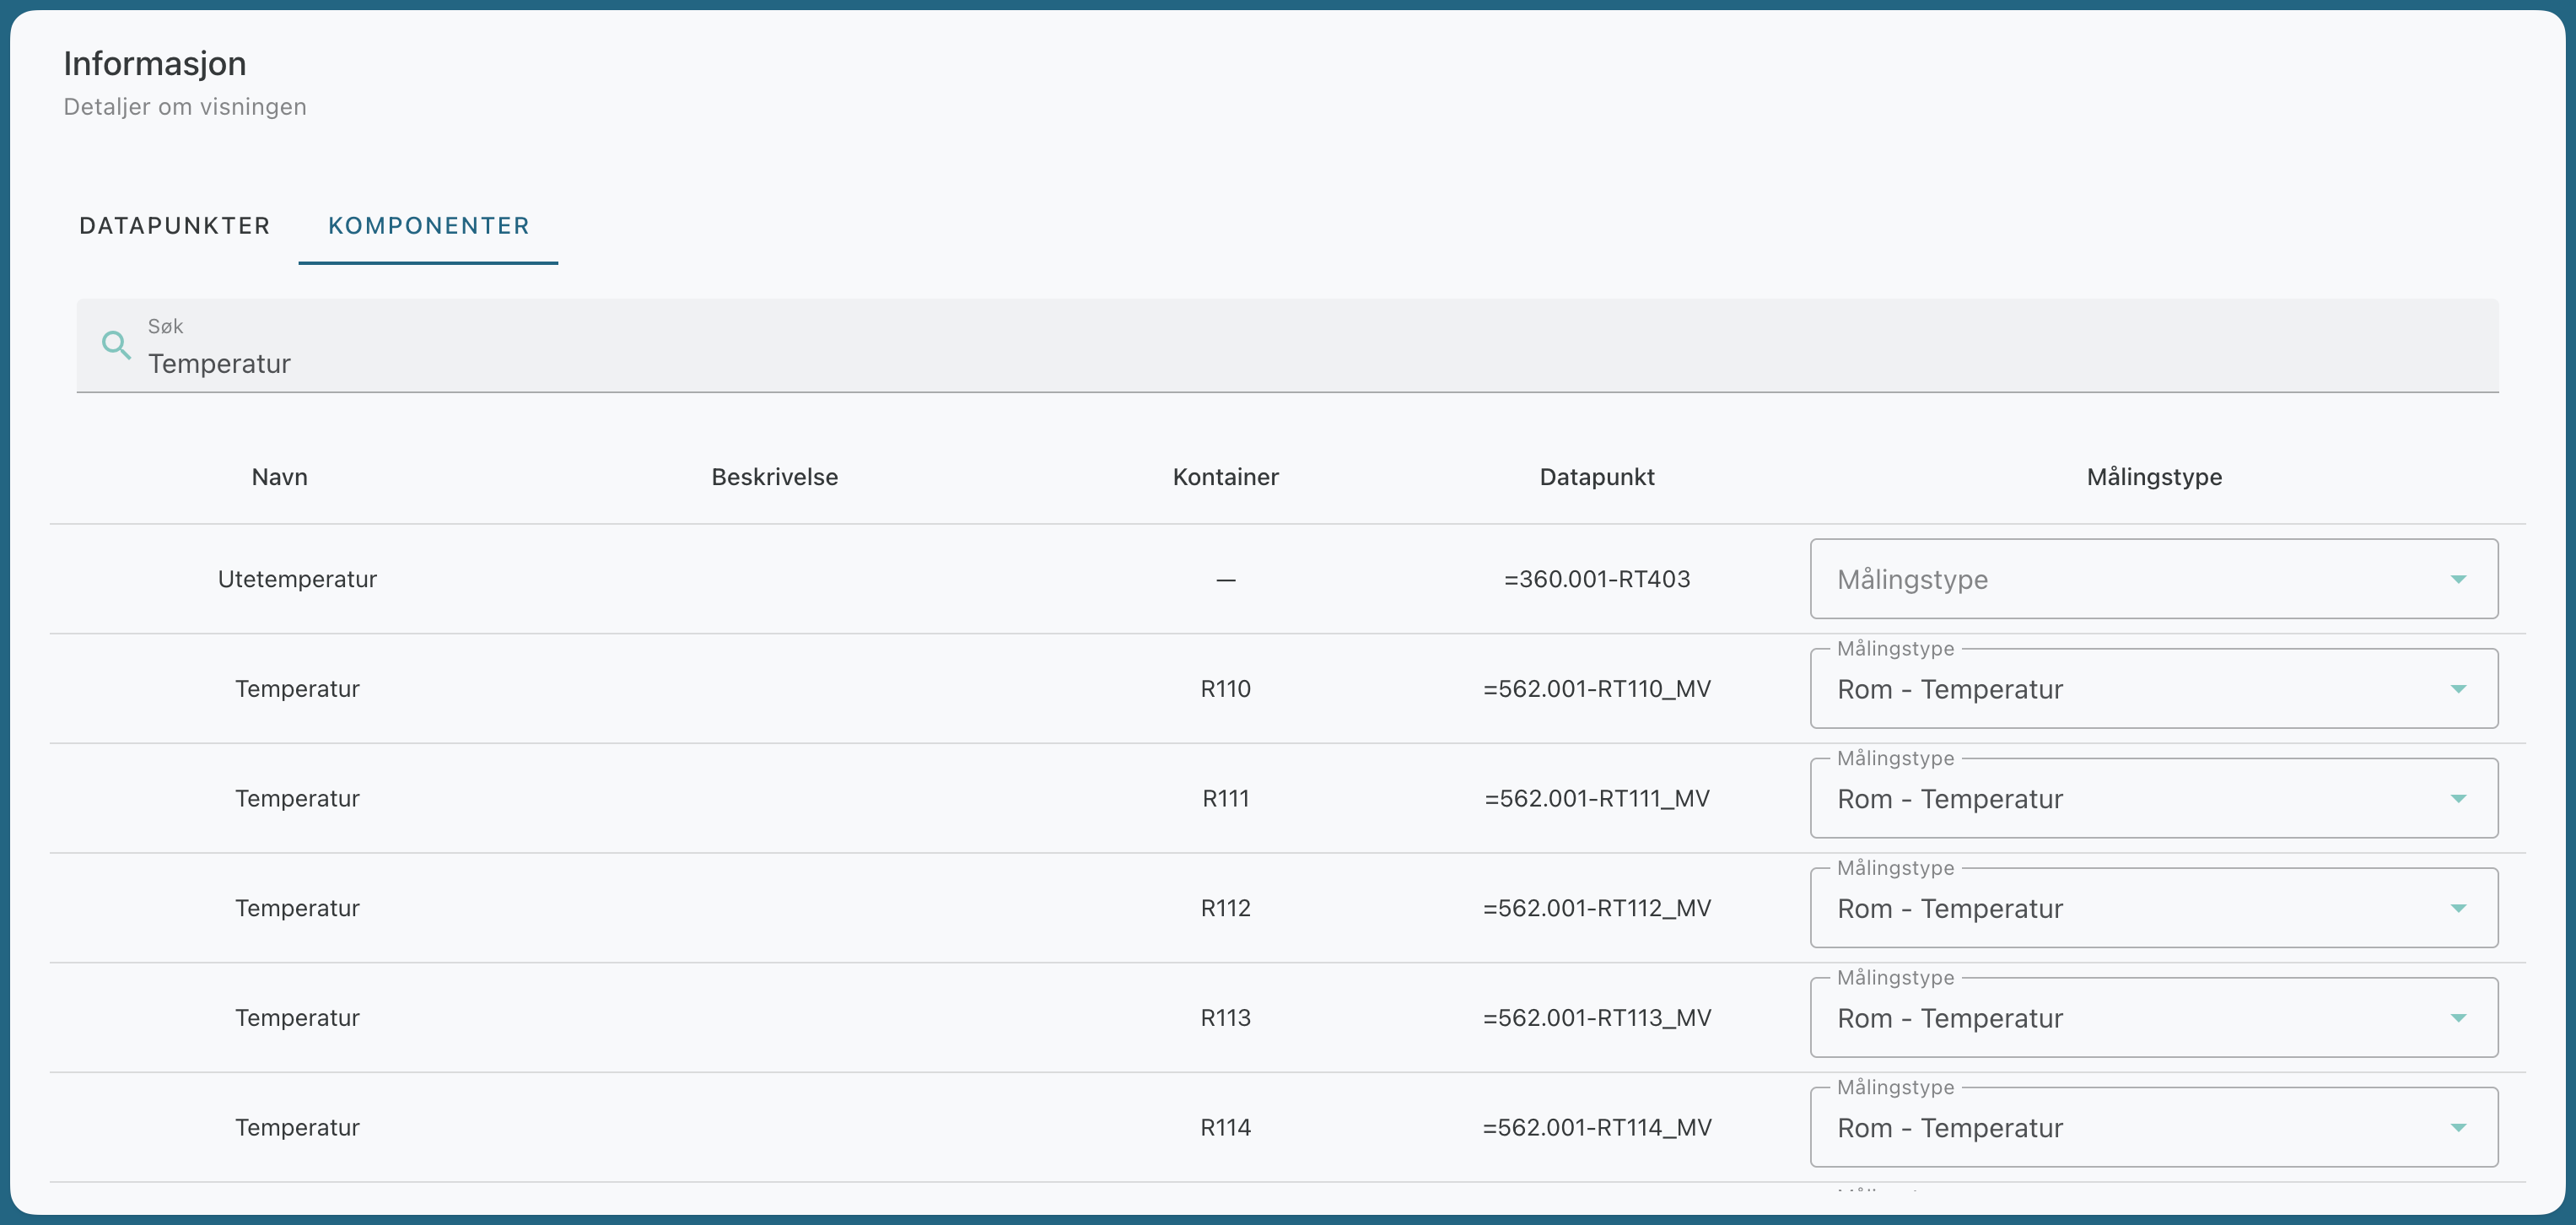
Select the Measurement Type for each component you want to display
Room - Temperature will instruct the system to display the value from this component/data point in the Dashboard’s Indoor Climate widget.