Logged data points
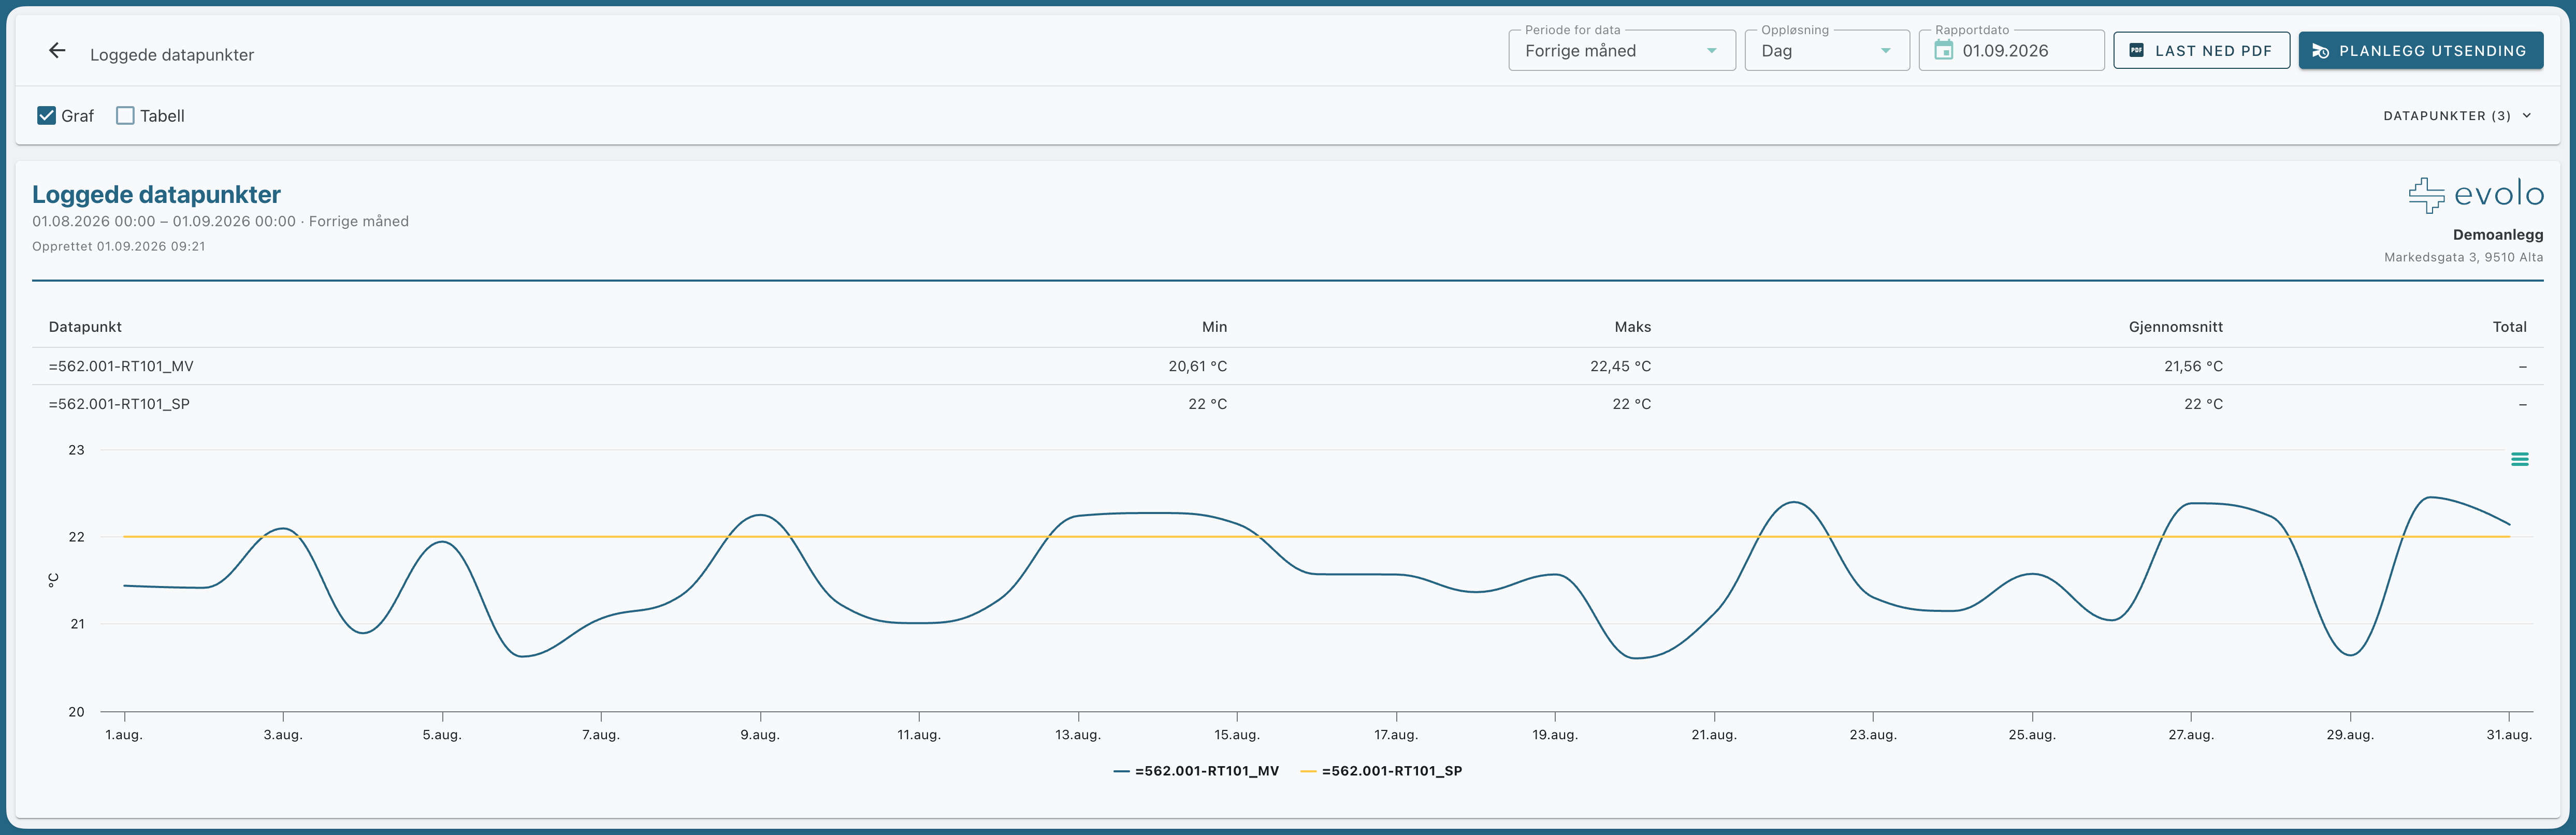
A custom report where you select the logged data points yourself. This is useful when you want to track the specific measurements you're interested in, all in a single report with a graph and a table.
Written By Evolo Support
Last updated About 1 month ago
Settings
You can change these settings:
Add data point: Select one or more logged data points.
Graph / Table: Display as a curve, table, or both.
For each data point, the minimum, maximum, and average are displayed, along with the sum for counters. Without selected data points, the report cannot be displayed or downloaded.
How to open, download, and You can find the planning report here.
Still need help? Ask the team