View consumption data from energy meters
Here you can see how to use the energy meter overview in Energy Monitoring. You can select a time period, download reports, filter data, and export figures from the charts.
Written By Evolo Support
Last updated 22 days ago
How to Use the Overview
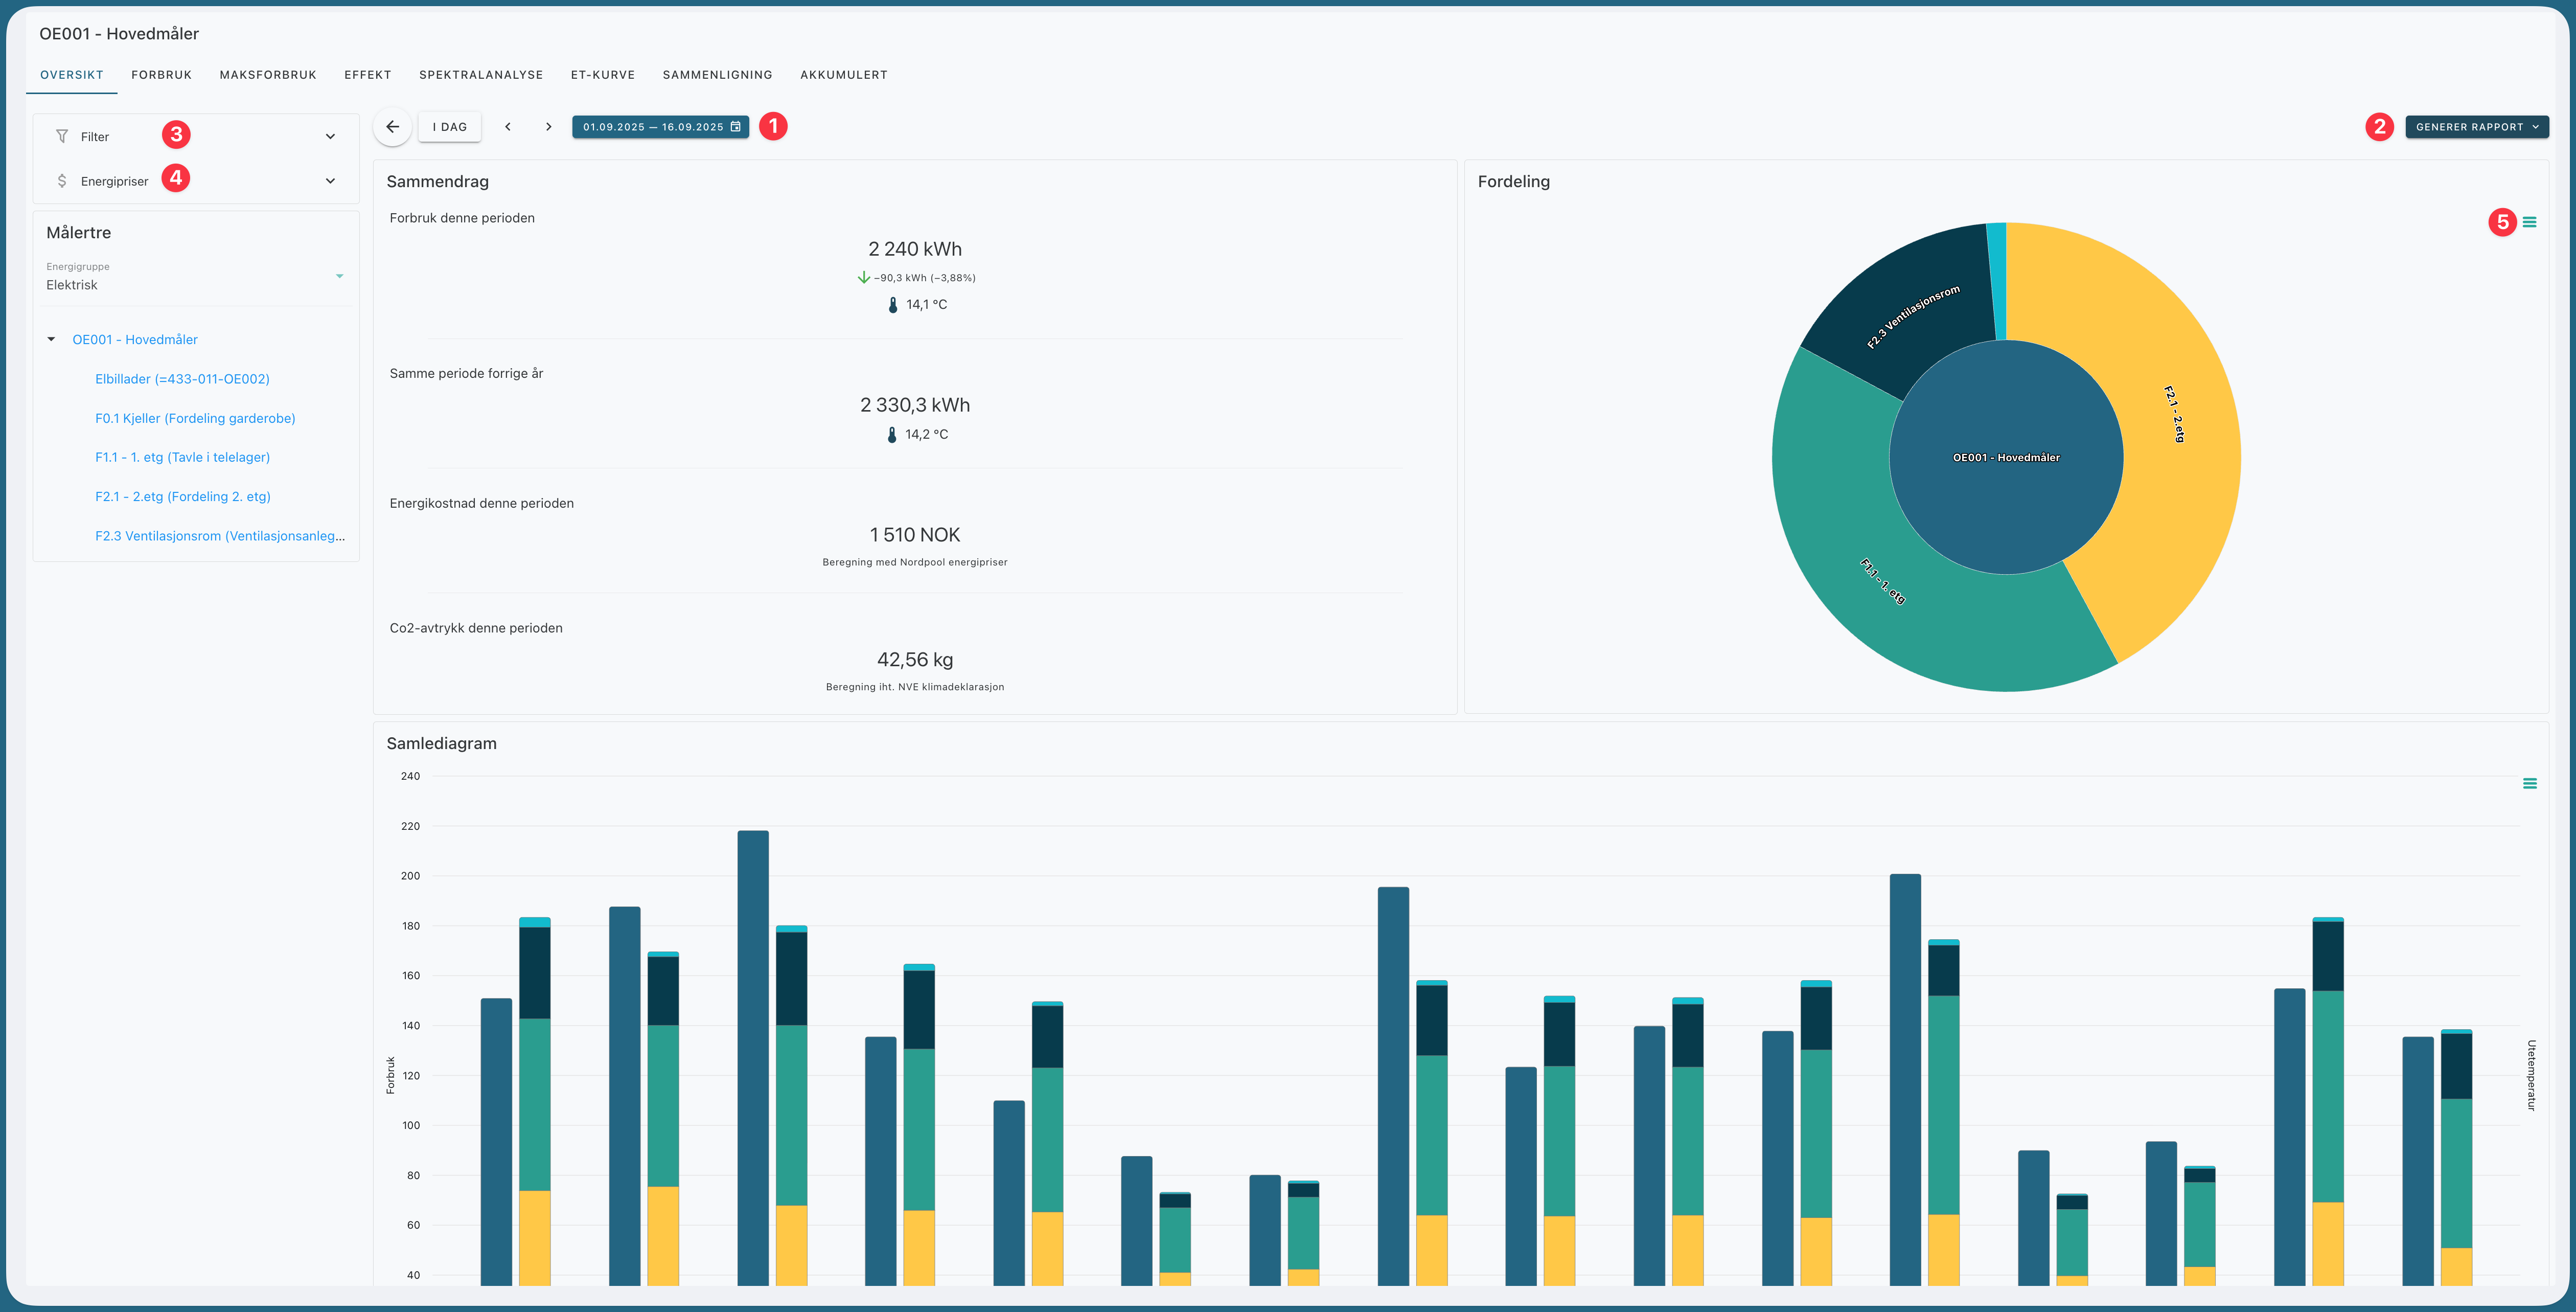
Select a period
Use the date picker to select the time interval you want to view. You can also compare it with previous periods.Download report
Click Generate Report:Energy Report: Opens the report view for the same period you’re currently viewing. You can adjust the period, resolution, and content before downloading a PDF.
Excel: Downloads an Excel spreadsheet with the data you’re viewing.
Filter data
Use the filter to remove unwanted values, such as corrupted or negative data.Use additional settings
In the settings, you can add extra parameters, such as spot price or CO₂ equivalents.Export data from charts
In the chart menu, you can download data as a CSV or Excel file.Explanation of the user interface
What You See in the Overview
Summary
The summary shows key figures for the selected period, including:
consumption during the period
comparison with the same period the previous year
energy cost
CO₂ footprint
Distribution
The distribution is displayed as a pie chart. The chart shows how energy consumption is distributed among various measurement points in the building.
Summary Chart
The summary chart is displayed as a bar chart. It is used to show consumption over time and to compare multiple meters.
Table
The table below the chart displays the values on which the graphs are based. Here, you can compare the numbers directly and download them for further analysis.
Use the summary to get a quick overview. Use the charts and table when you want to compare meters or take a closer look at trends over time.
Was this helpful?
Still need help? Ask the team