News from Evolo, June 2024
What's New in Evolo: Energy Monitoring Summary ⚡
Written By Evolo Support
Last updated 17 days ago
Energy Monitoring
New Overview - Energy
View a summary of all meters, including costs and CO2 equivalents.

Summary Get a quick overview of consumption for the selected period, compared to the same period last year. Energy costs and CO2 equivalents.
Breakdown The circle in the center represents the main meter, while the rings around it represent the sub-meters. This provides a visual overview of the breakdown of energy consumption.
Combined Chart Visualizes all energy meters in a single chart, with the option to compare them to the main meter.
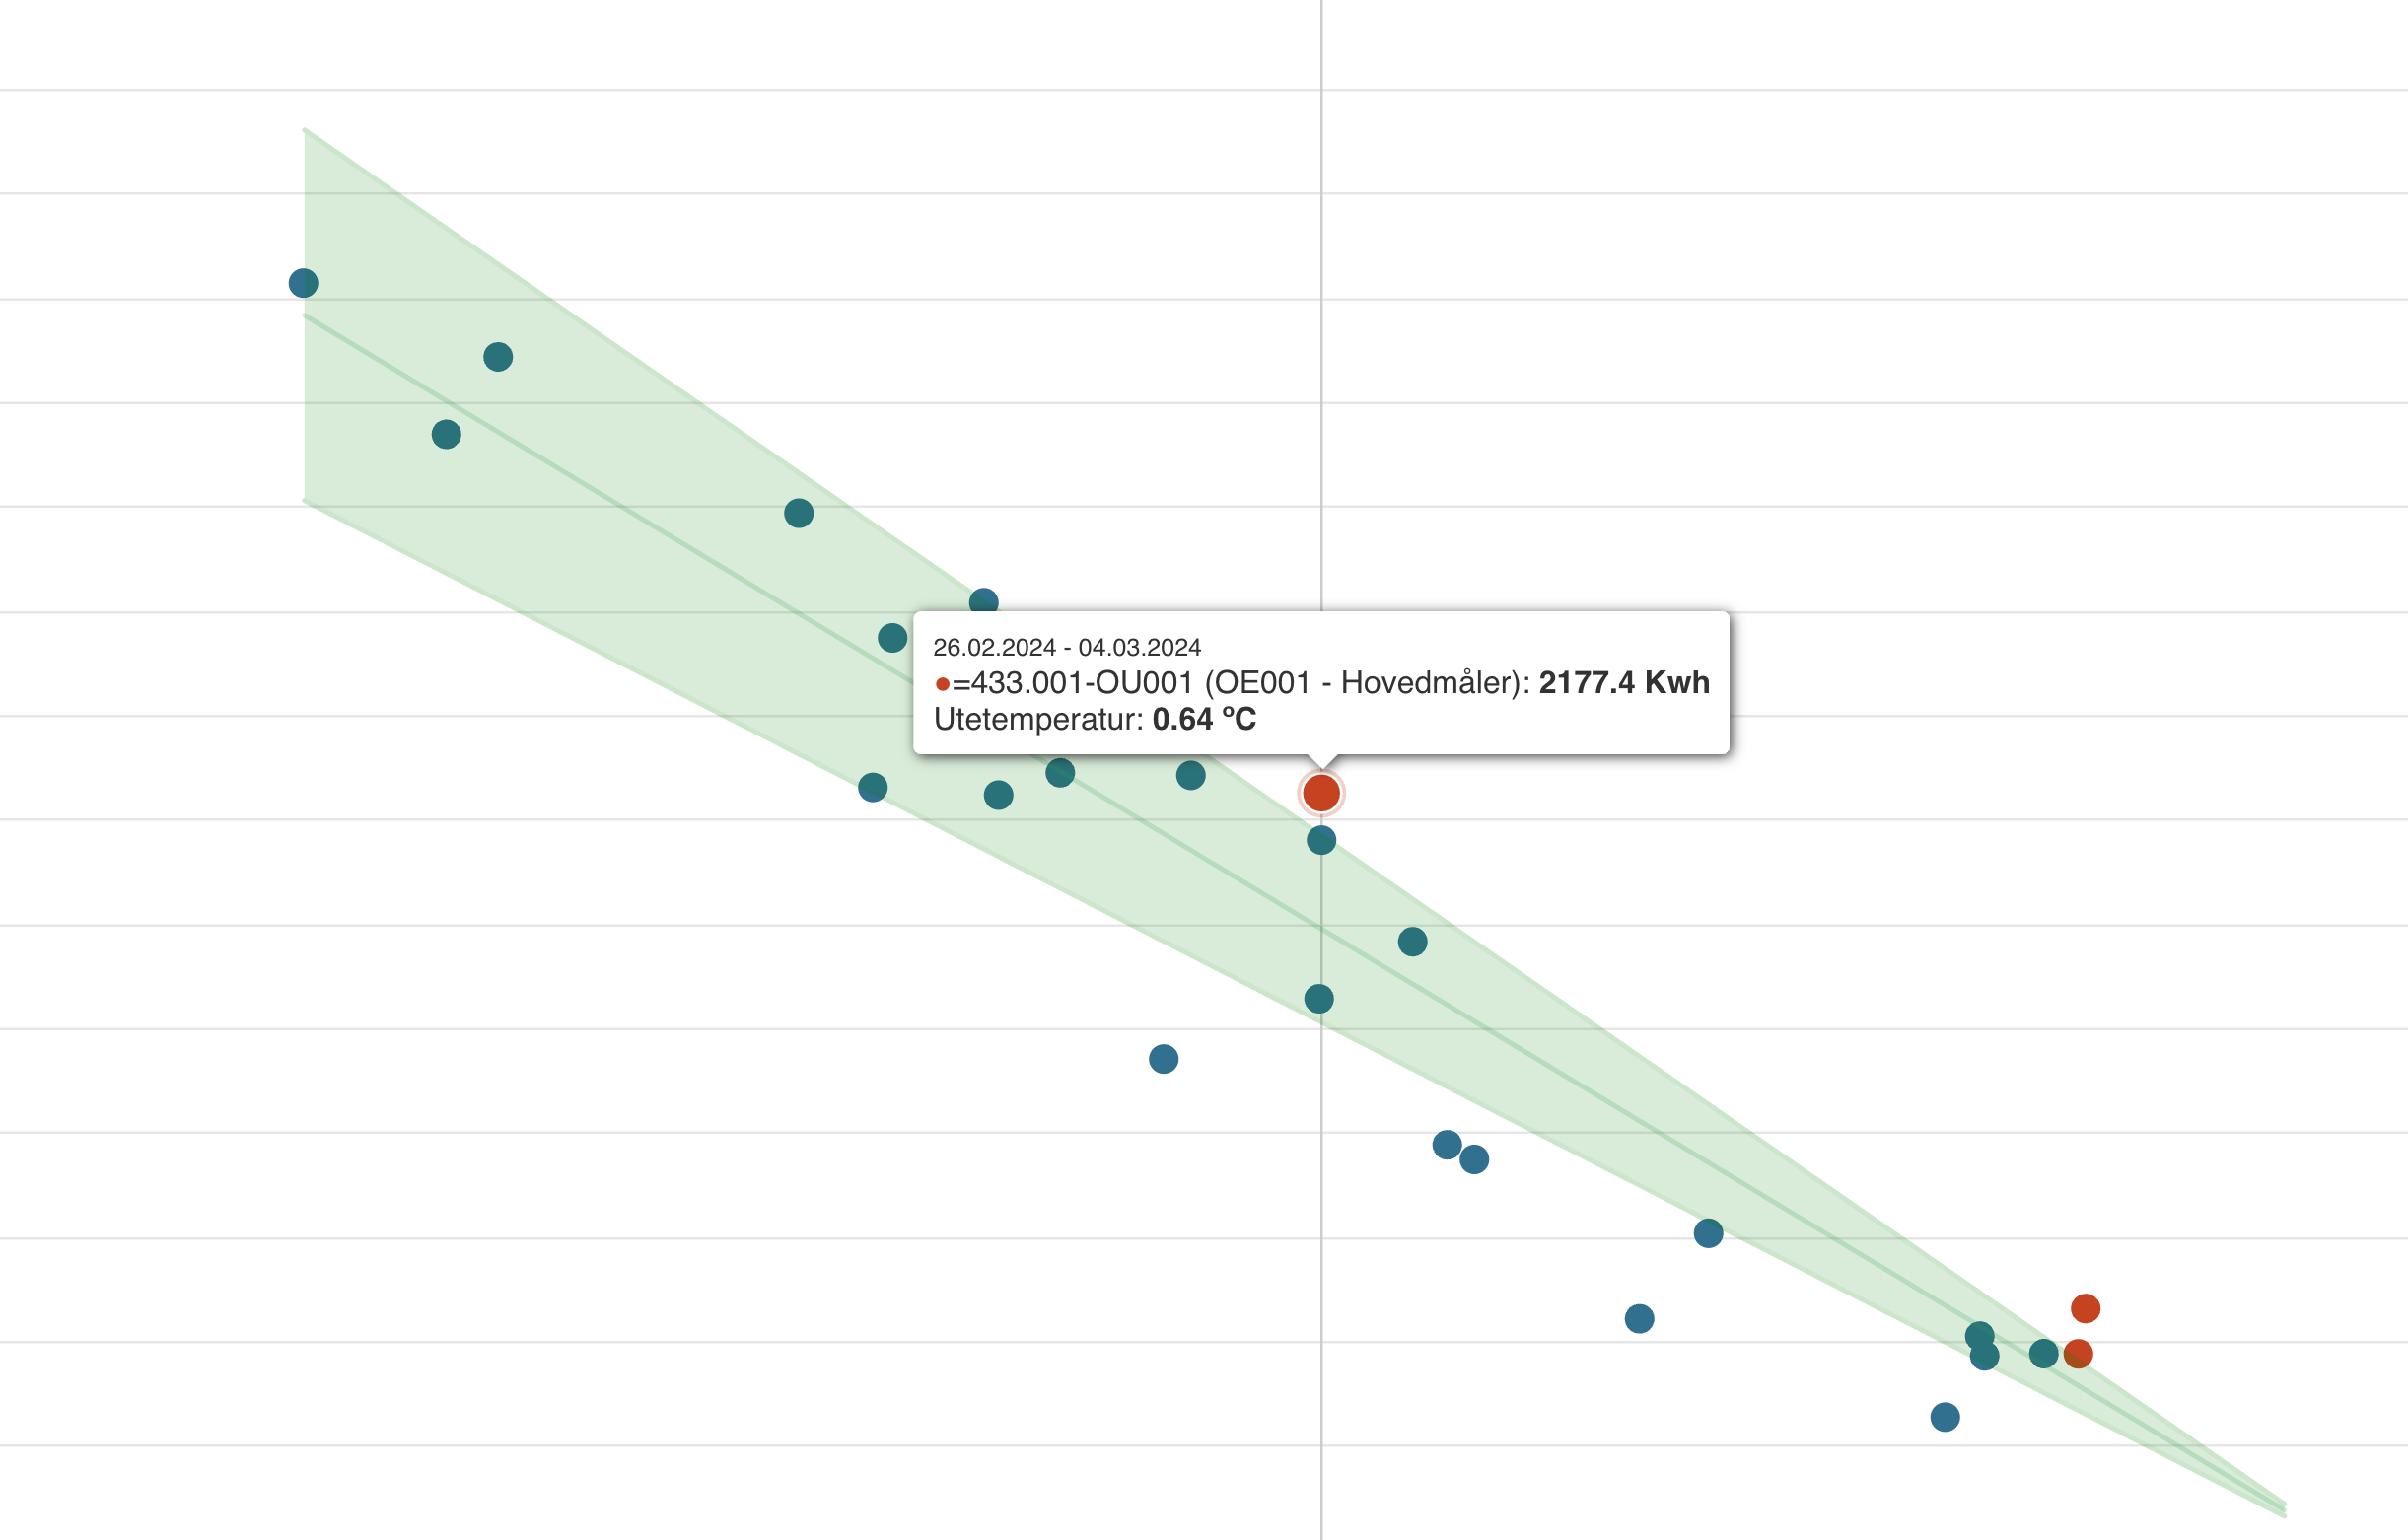
New design for the ET curve
With more options for consumption limits and periods. Now displays deviations in red and plots a consumption limit based on kWh or percentage change.
General improvements
The Topology module has been expanded to include more information about the interface.
You can now submit requests for new features to Evolo’s Roadmap.
For Installers
Image: The View Builder now supports the WebP image format with animations.
Data Point Import: When importing data points, you now have the option to update existing data points based on unique names.
BACnet: Has been updated to support reading BACnet notifications and alarms. All objects in the BACnet Operator Workstation (B-OWS) profile can be read from and written to your BACnet devices.
Learn more about scanning BACnet objects