Use the analysis tool
The analysis tool in Evolo lets you select data points, customize the view, and generate reports in PDF or Excel format.
Written By Evolo Support
Last updated 8 days ago
How to Use the Analysis Tool
Search for the data points you want to analyze.
Save the selection if you want to use it again later.
Change the time period and resolution of the data.
Use filters if you want to handle peaks or outliers in the data series.
Enable Live Data if you want to update the graph with real-time values for the selected data points.
Generate a report in PDF or Excel.
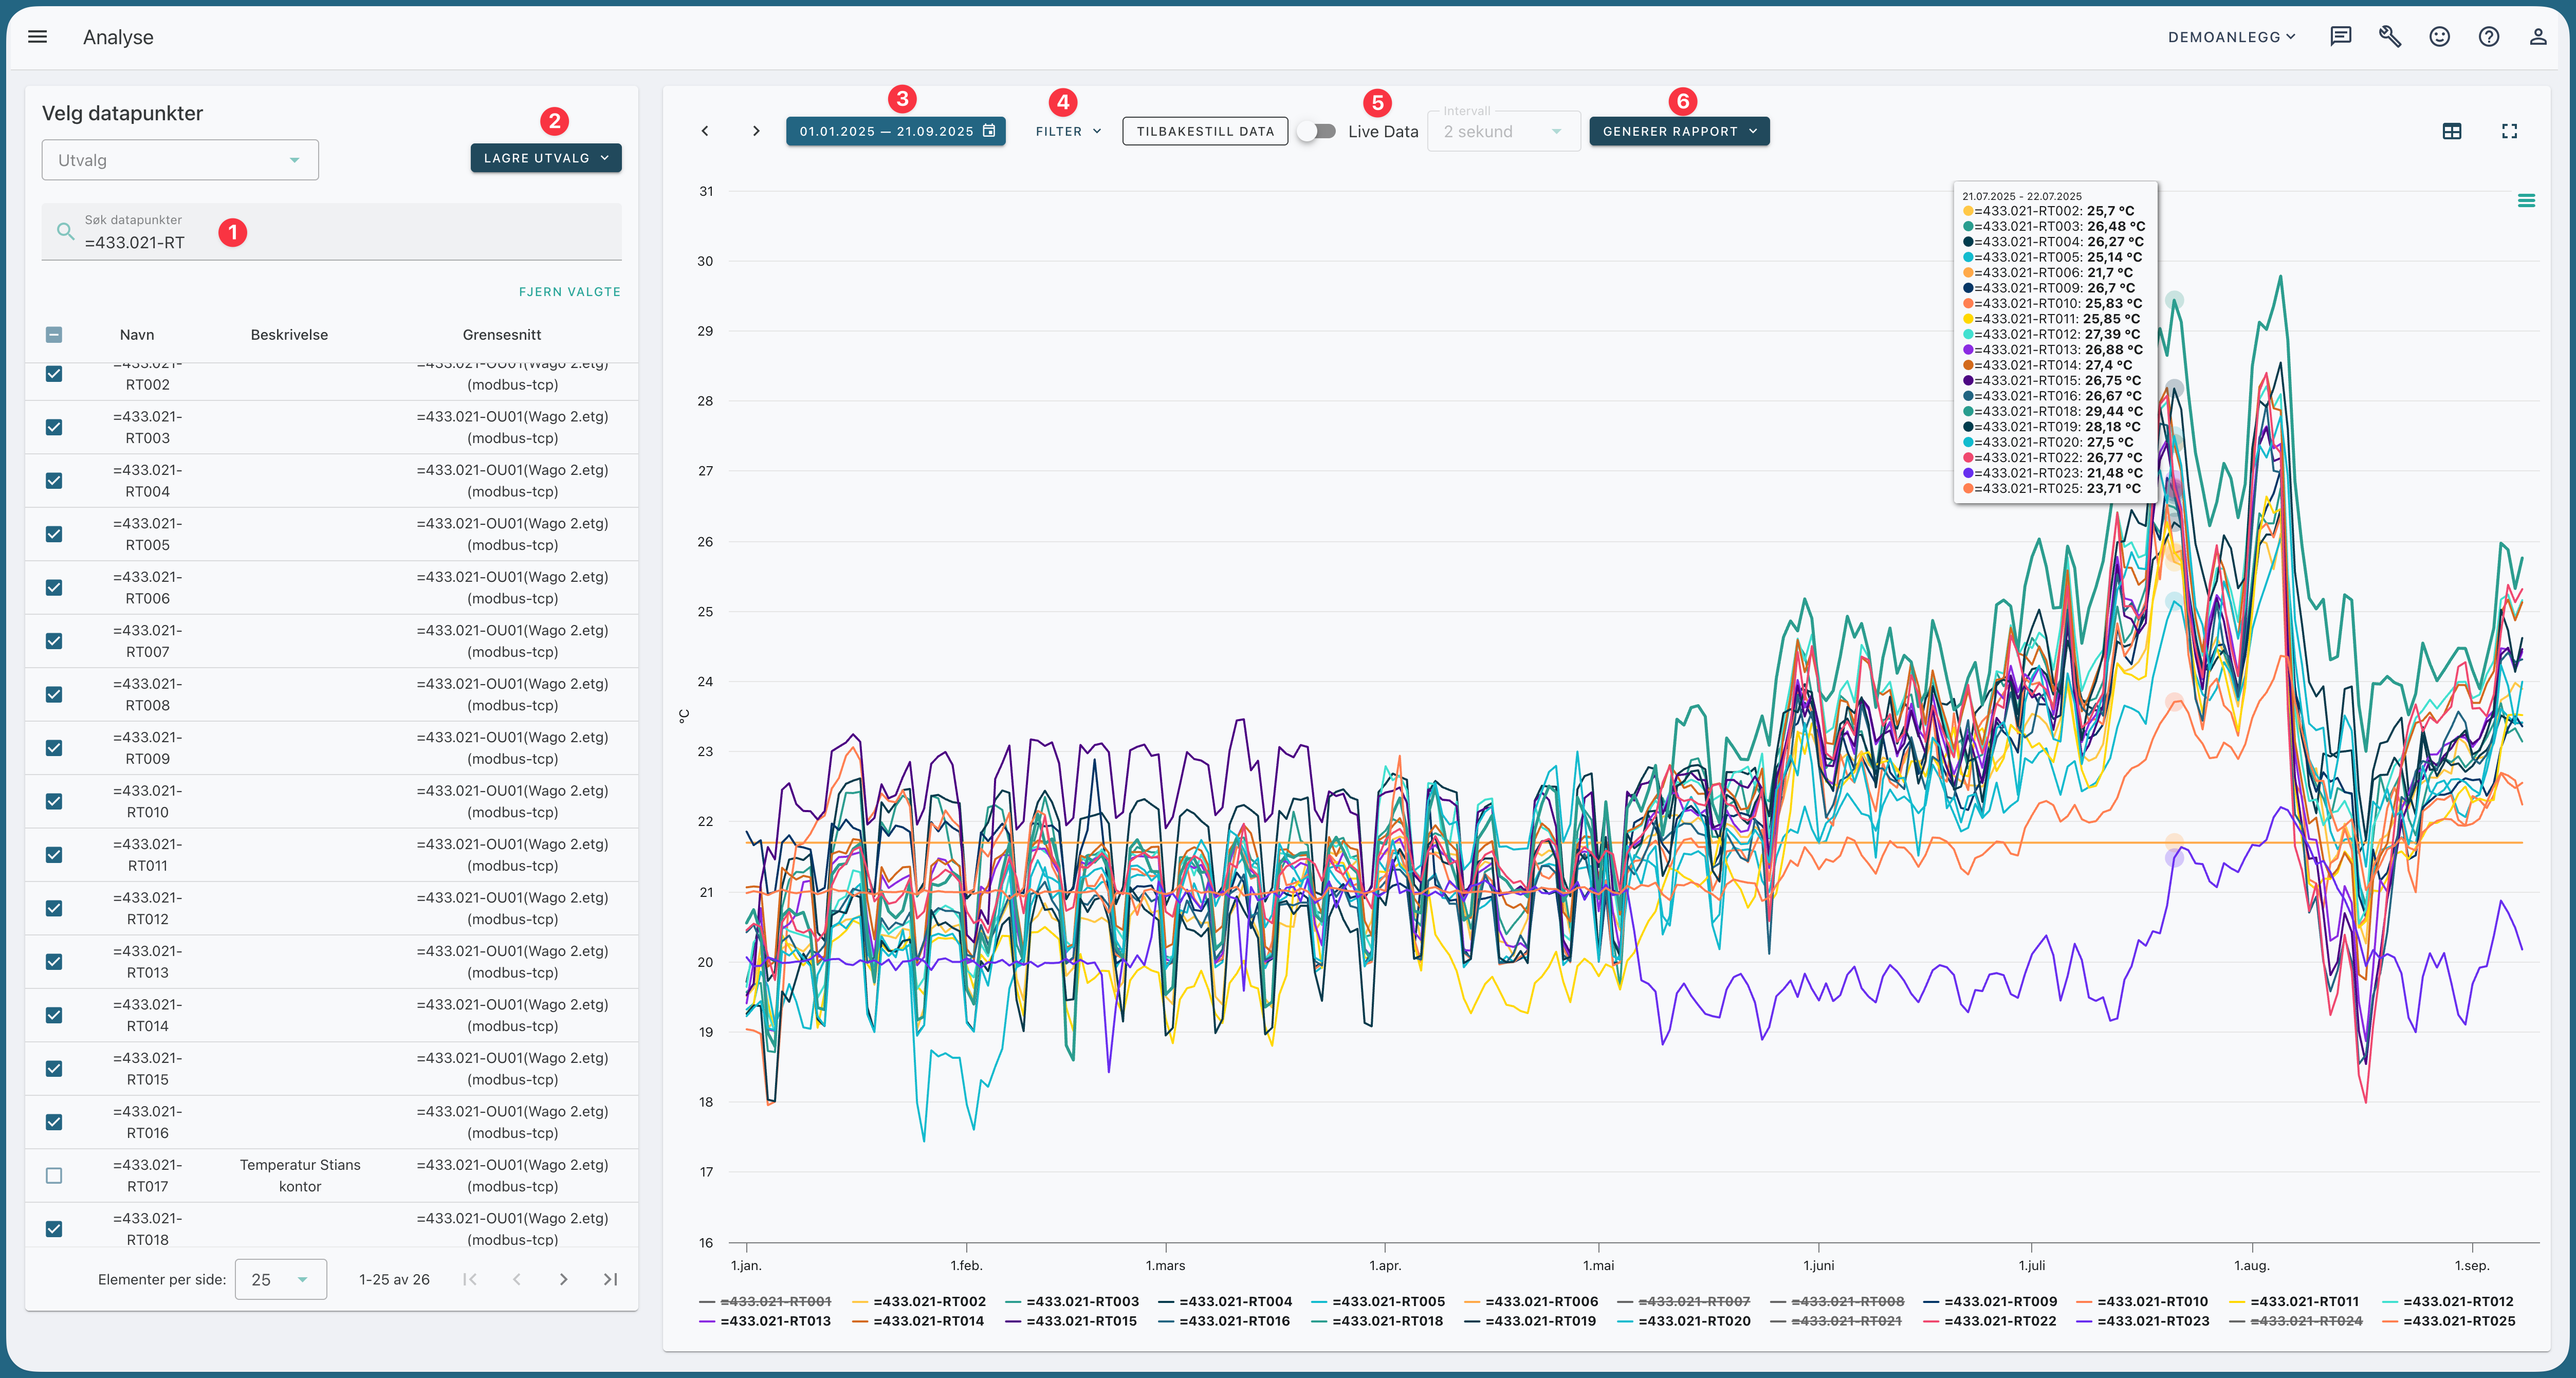
The analysis tool is ideal when you want to compare data points, analyze trends over time, or export the results to a report.